Omnichannel
Measurement
Making omnichannel performance measurable across reach, engagement, and journey progression.
A unified analytics experience helping commercial teams understand brand performance, channel reach, customer engagement and customer journey movement in one connected product.

Meet Alex.
Commercial Insights Lead
I can see what our channels are doing. I need to understand what that means for our customers.
Illustrative persona representing product user needs.
Goals
- Track omnichannel and brand performance
- Understand what drives HCP engagement
- See movement across journey stages
Frustrations
- Metrics exist but the story is fragmented
- Different views answer different questions
- Comparisons take too much effort
Needs
- Clarity
- Comparability
- Actionability
From fragmented metrics to connected decisions.
Commercial omnichannel performance involves multiple dimensions — business outcomes, digital reach, customer engagement and customer journey progression. Each answers an important question, but users also need to understand how those measures relate to one another.
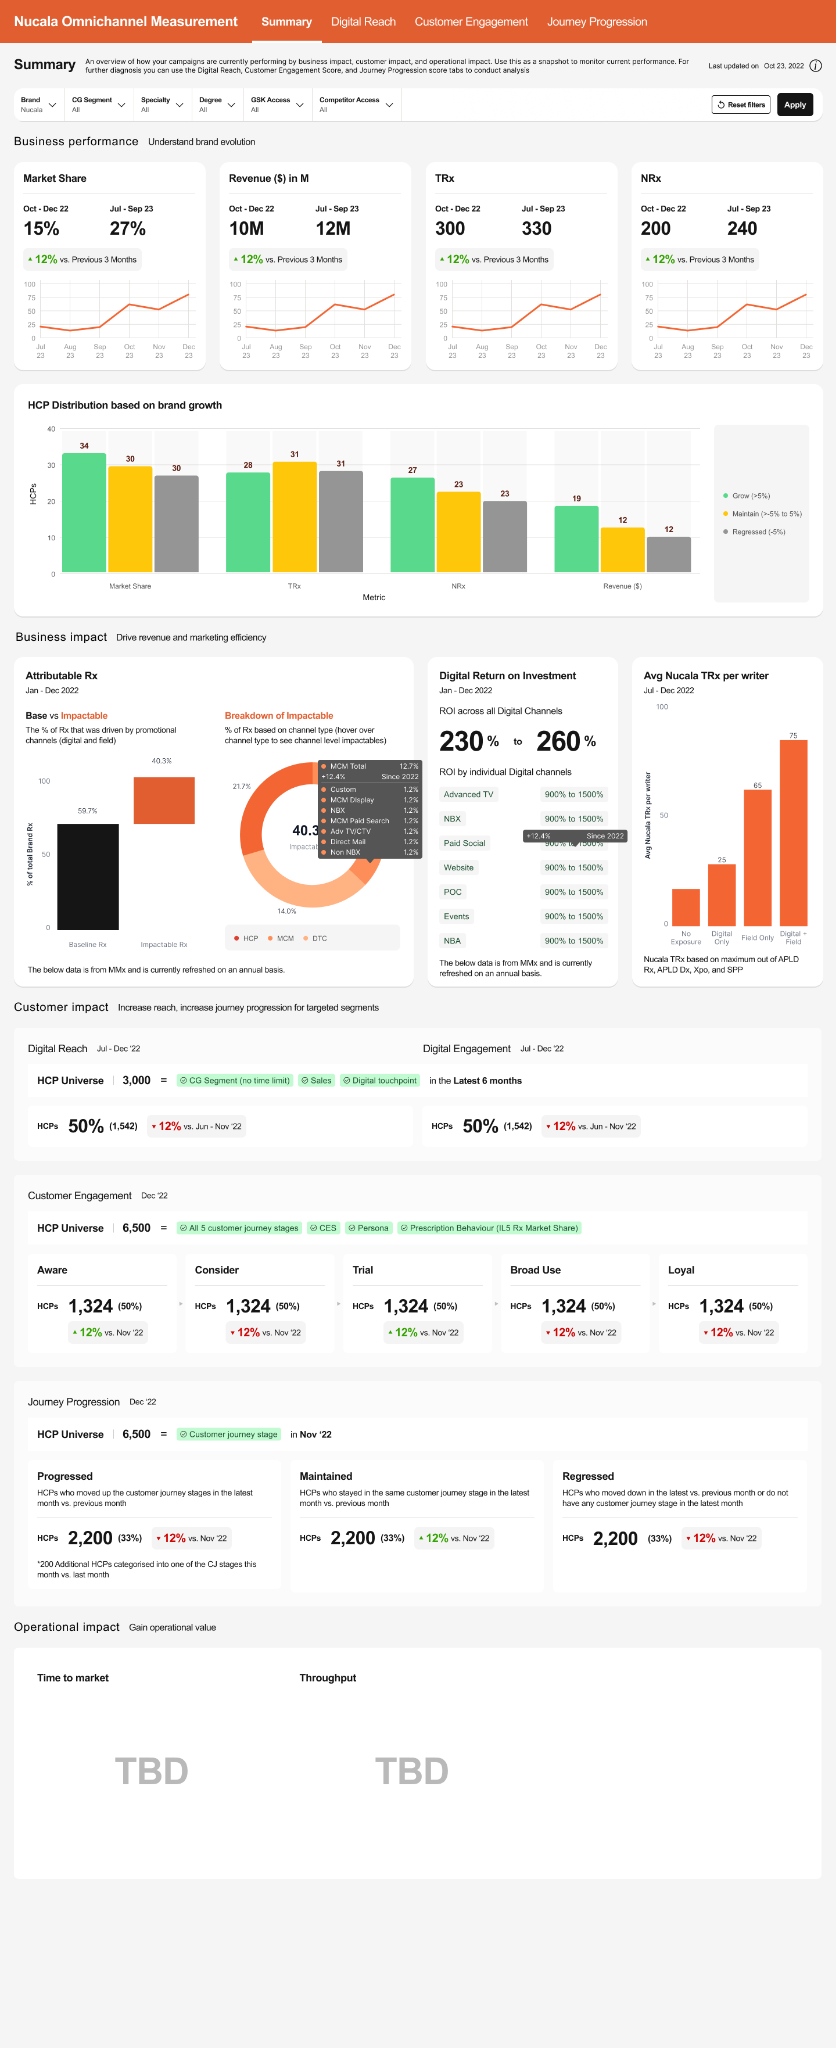
Business performance
Market share, prescriptions, revenue
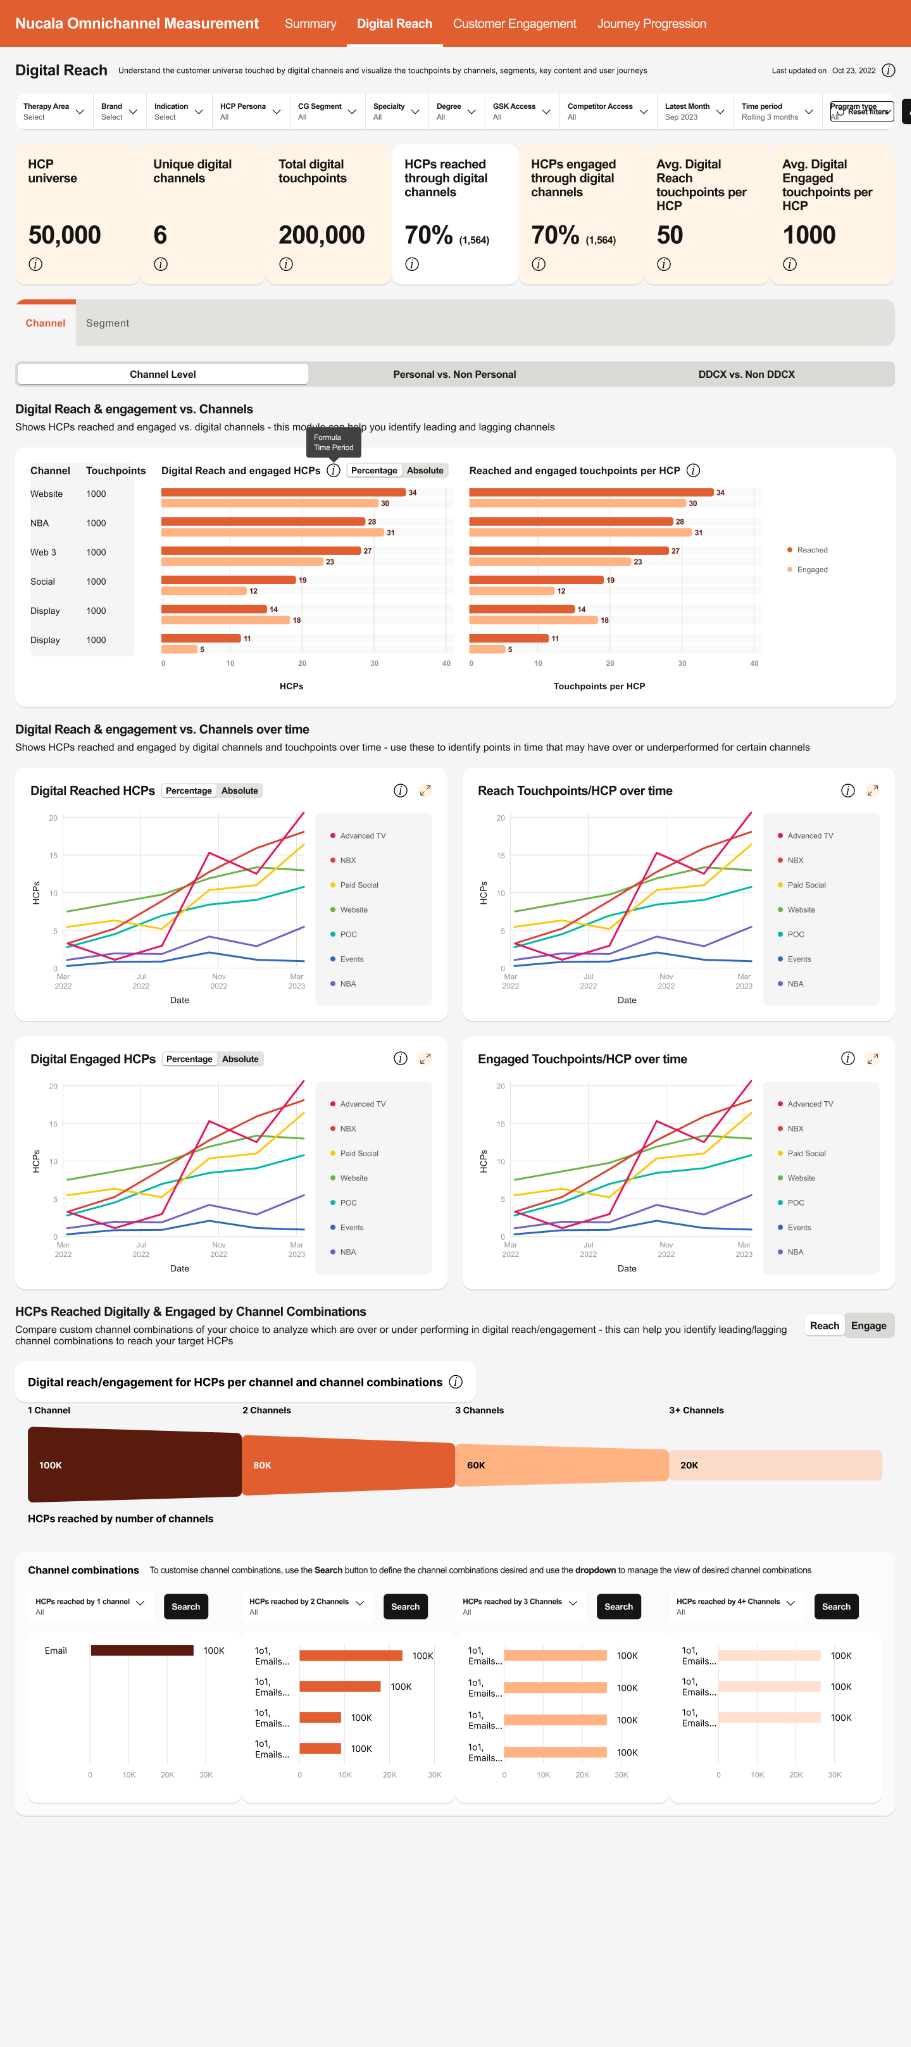
Digital reach
HCPs reached, channels, touchpoints
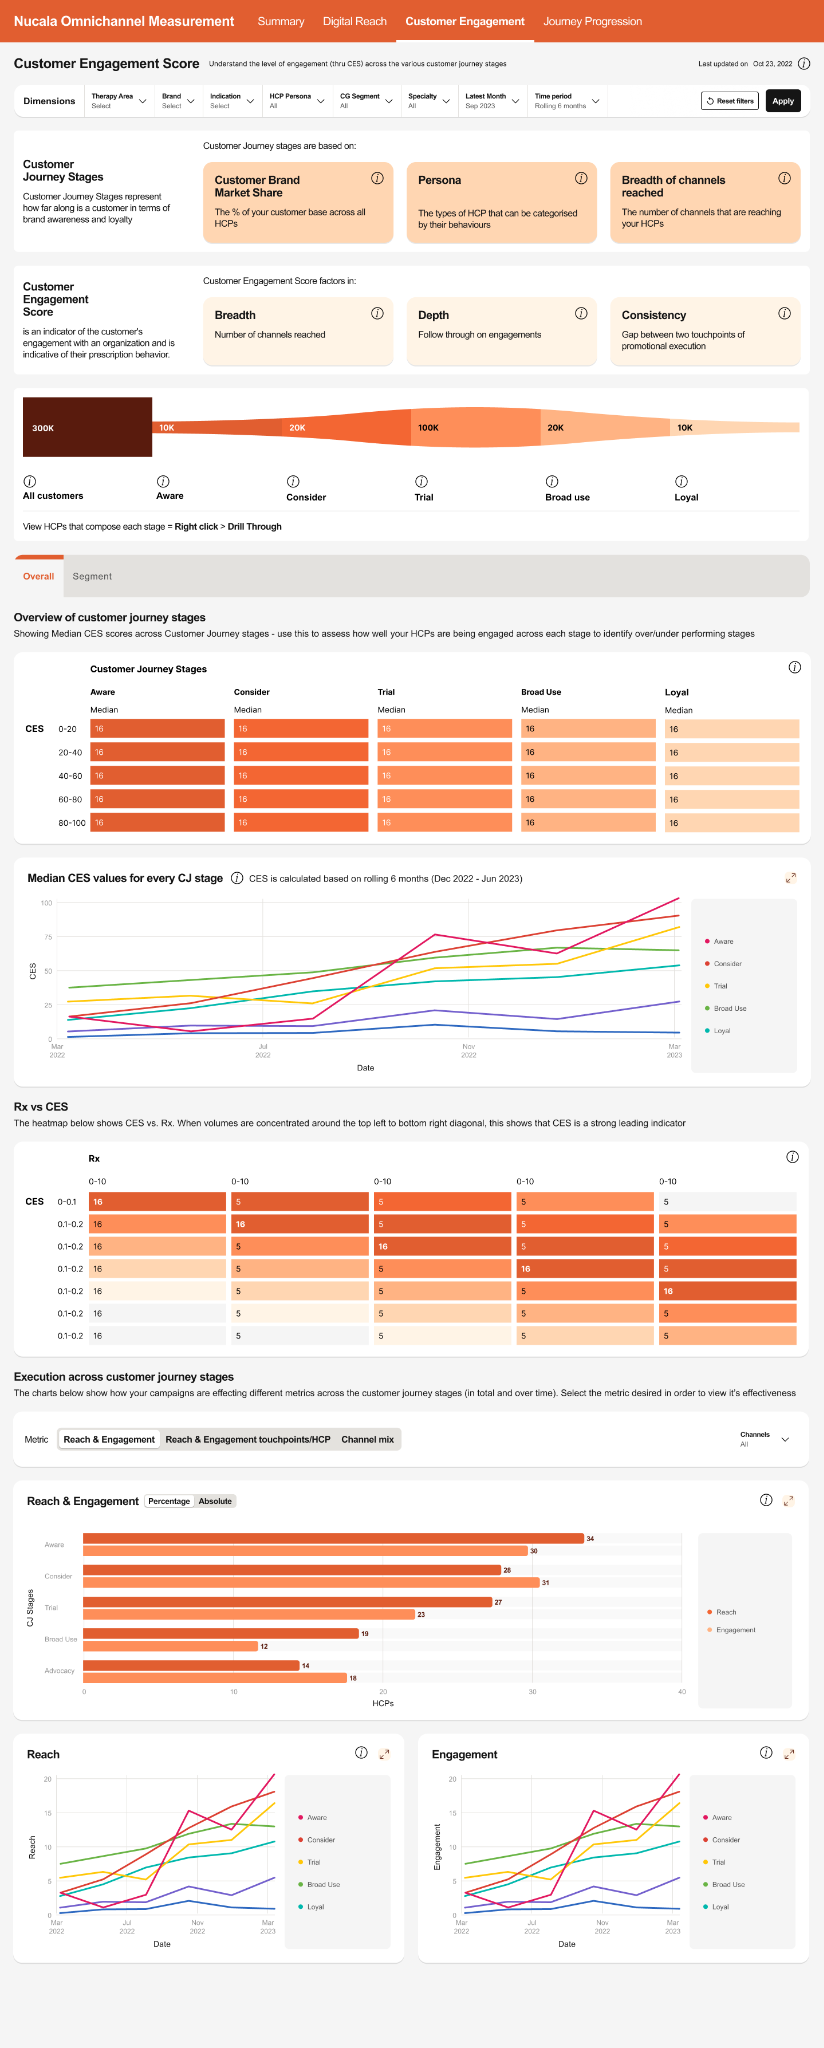
Customer engagement
Engagement scores and journey stages
Journey progression
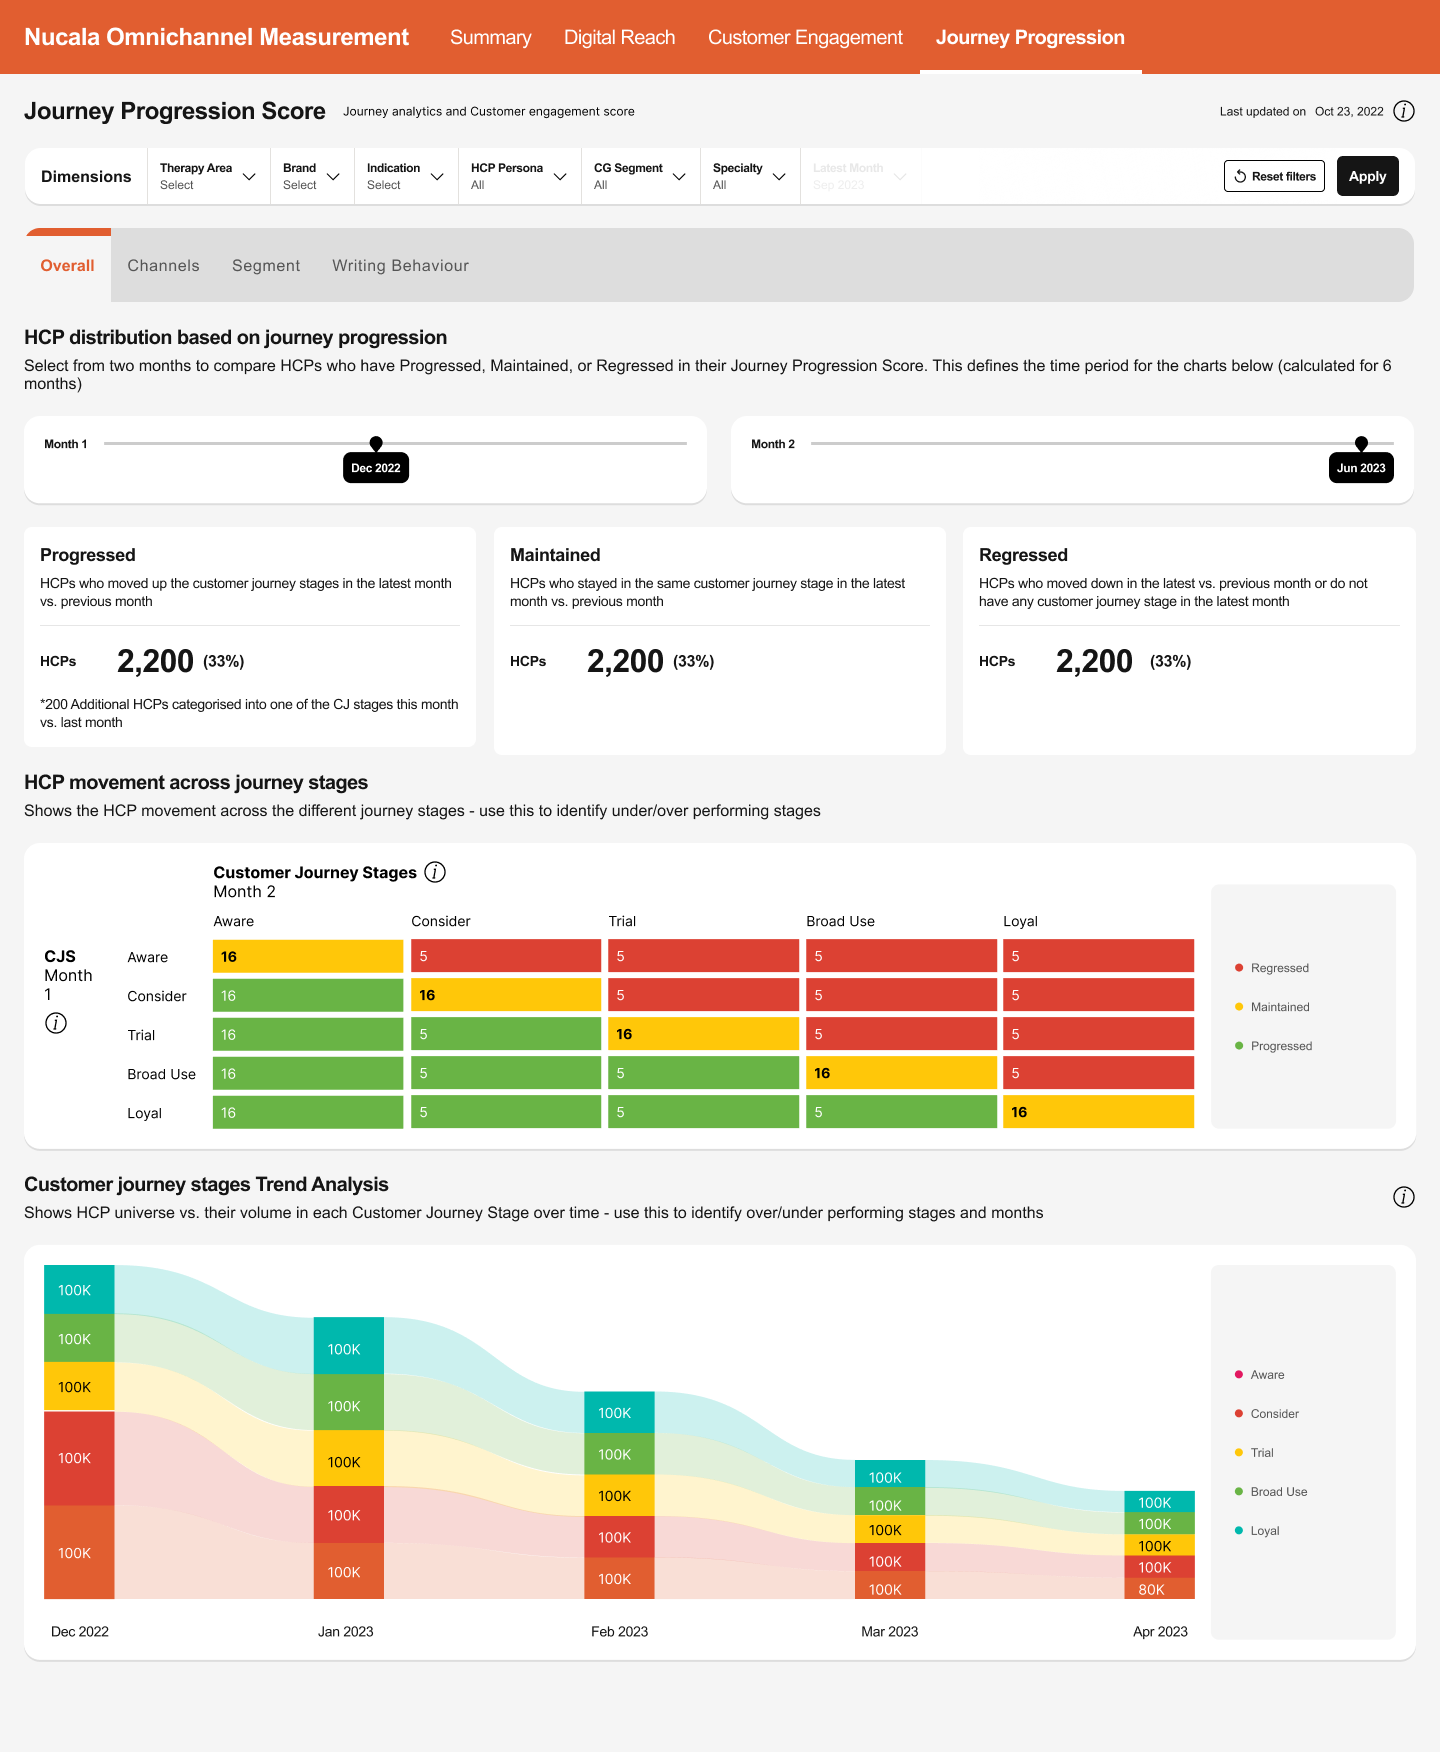
Progressed, maintained and regressed
Designing the measurement system.
I approached the work as a decision-support system: surface the most important signals first, make related metrics comparable and let users move from an overview into diagnosis without losing context.
KPI hierarchy
Surface the most important measures first, with a clear structure from overview to detail.
15% → 27%Comparability
Make it easy to compare across periods, channels, customer segments and stages.
━━━━━━━
Drill-down logic
Move from high-level summary into the why, without losing the thread.
↓ ↓ ↓Reusable patterns
Consistent filters, chart conventions, navigation and layouts across views.
⌗ ⌗ ⌗Decision support
Highlight trends, gaps and under- or over-performing areas.
↗ ↗Four lenses.
One connected view.
The experience brings together four complementary perspectives of commercial performance in one coherent product.
Understand the bigger picture.
The executive overview connects commercial performance with customer measures, giving users a way to identify which signals deserve a deeper look.
Key details that drive insight.
Channel comparisons
Compare reach and engagement across channels to identify leading and lagging performance.
Longitudinal trends
Track shifts over time to spot momentum, changes and emerging opportunities.
Progression matrix
Understand movement between journey stages and identify where further progression is needed.
From data to commercial action.
Makes complex analytics easier to read
Turns multi-source, multi-metric data into a clear, structured and consistent experience.
Links overview to diagnosis
Supports movement from high-level performance to the underlying drivers by channel, segment or stage.
Supports better decision-making
Gives commercial teams the clarity and context to identify where to focus attention.
The challenge isn't simply making data visible. It's designing the relationships between information so people understand what they're looking at — and what to investigate next.